How to measure the success of your product features?

Most often as product managers and product owners we are building on an increment of an existing product for a release. And most times the increment is through a set of features. Although we maintain a set of metrics and KPIs to measure the success of the product with the help of tools like a product score card, we ignore to measure the success of individual features. And a lack of attention to measure the effectiveness of individual features leads to an attitude of what Marty Cagan calls as building ‘feature factories’ also called 'feature bloat', 'featuritis', or 'feature creep'. Here’s the popular quote by Marty Cagan:
“Unsuccessful product teams most often are all feature factories, with little regard for whether or not the features actually solve the underlying business problems. Progress for them is measured by output and not outcome." - Marty Cagan
Let’s try to understand what Cagan meant by progress being measured through output and not outcome.
Output for most product teams would read something like:
“We completed 10 user stories in this sprint
“We shipped four new features this month
Output here doesn’t mean anything other than measuring a volume of work. There is no measure of the impact of the very work.
Outcome on the other hand would read something like this:
"We helped reduce 15% of our core customers time through making our workflows better"
Outcome is the measure of the impact your feature had directly to your customers.
The role of a product managers/POs is not to build features, but to enhance value. Sometime deciding upon not building a feature is sometimes more important than building a feature. How do you do that?
Metrics.
MIND YOUR METRICS
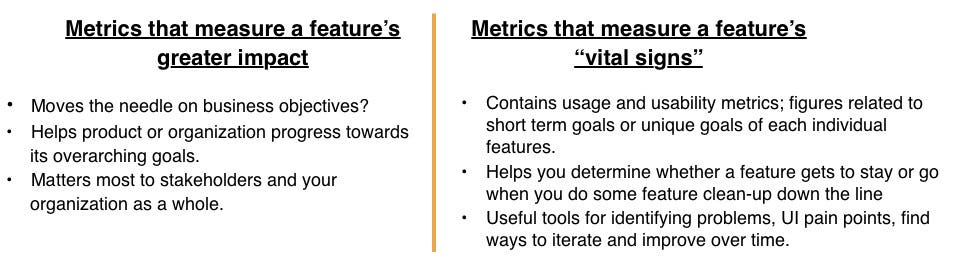
Metrics are an indicator of both health of a feature and its success.
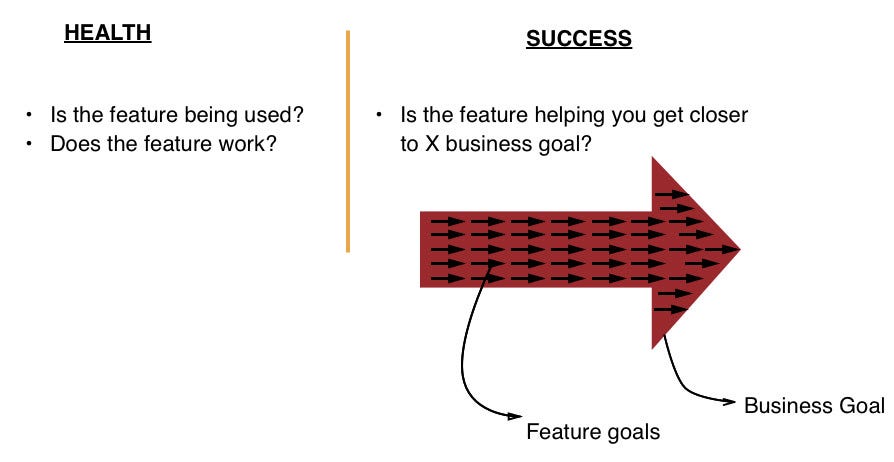
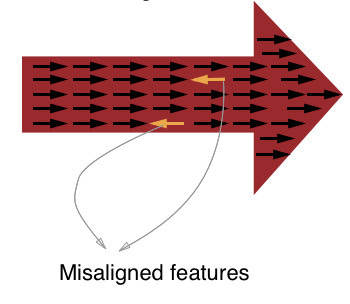
Each of your feature goals must be aligned to the larger business goal/product goal. Even if one feature in your release is misaligned to the larger goal of the release, it reduces the effectiveness of your product.
Identifying metrics that matter
A feature's key metrics depend upon various factors like:
Product vision
Business goals
Nature of feature itself
A good idea for your feature is to cover atleast two of the above metrics.
Frameworks for feature metrics
There are two frameworks that I have known to be useful to track feature success:
Dave McClure's Pirate Metrics
Google's Heart Framework
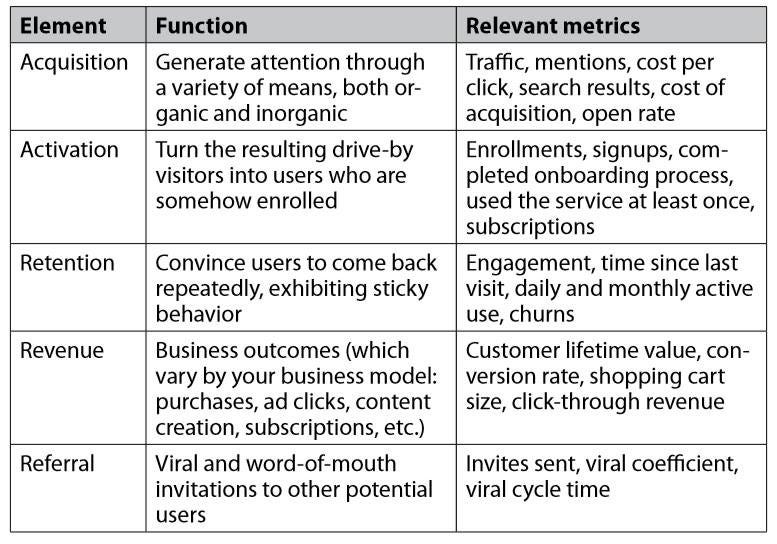
Dave McClure's Pirate Metrics
Pirate Metrics are most suited for new products that is vying for discoverability and user adoption.
Google's HEART Framework
https://clevertap.com/blog/google-heart-framework/
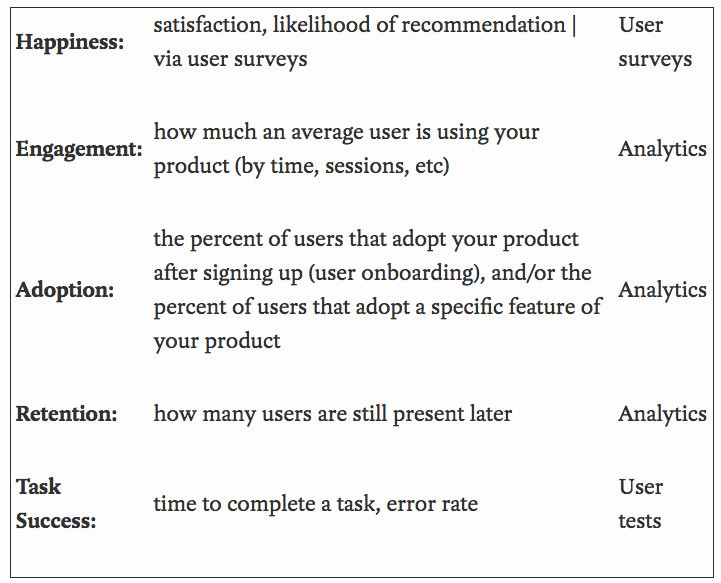
I am a big fan of Google's HEART framework and apply it to measure the success of the features I build at work. The HEART framework is most effective to measure the quality of User Experience. You can apply HEART to specific feature or to a whole product.
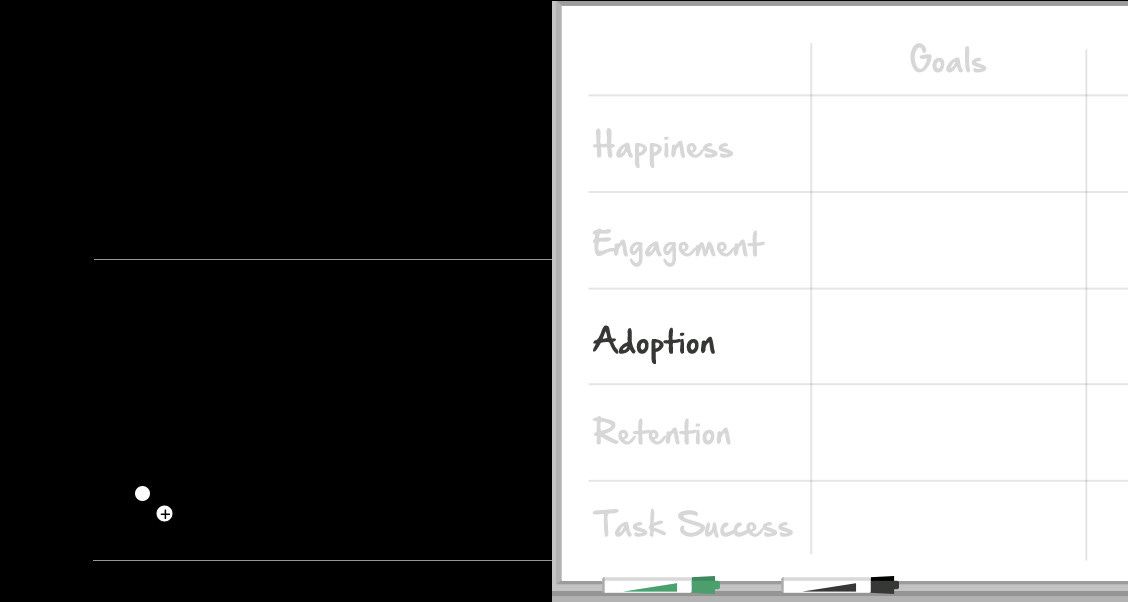
Choose one or two categories in the HEART framework that are the focus of your product or project.
How do you measure HEART?
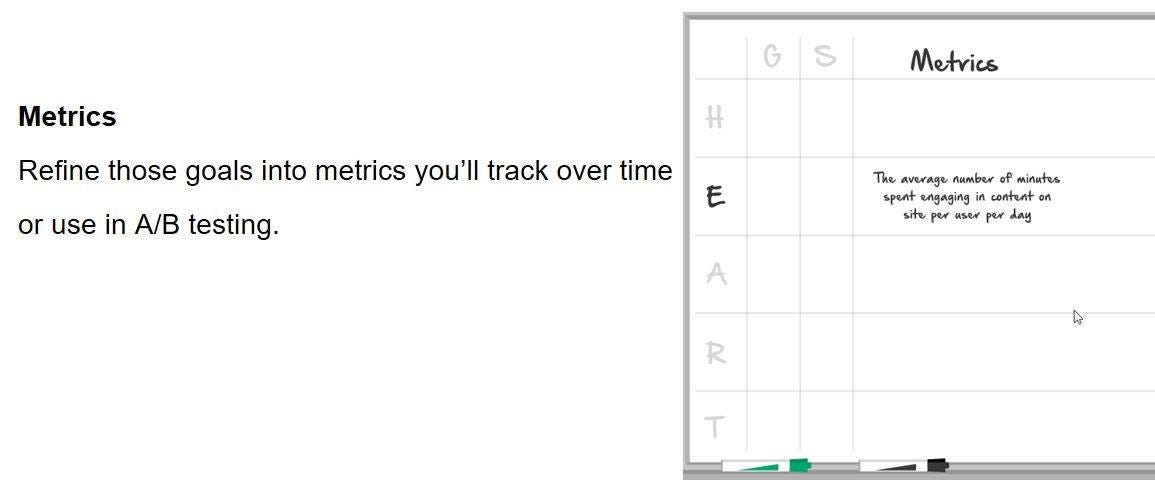
But how do you figure out which metrics to implement and track?

The Goals Signals Metrics process facilitates the identification of meaningful metrics you'll actually use.
CALL TO ACTION
Identify feature's vital signs (metrics)to help you access its health and success over time
......before you begin building
.......start tracking them as early as you can.
Do let me know if you agree or disagree with my views here. Also let me know how do you measure the success of your features.
UPDATED POST: 28/1/2021
BDF FRAMEWORK
If the product is driving value for the customer, you decrease the risk of churn and increase the likelihood of upsell of new modules.
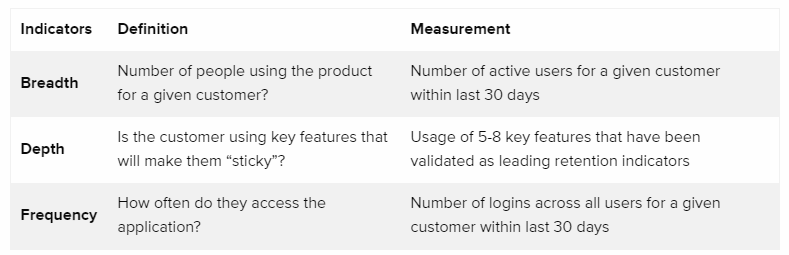
Another popular framework to measure product success is using three indicators: breadth, depth & frequency:

3 KPIS ALL PMs SHOULD KNOW
Feature Adoption
Product Stickiness
Product Usage
Feature Adoption
In fact, up to 80% of product features go unused, and those that do gain initial traction typically lose users over time.
To keep this situation from happening again and again, PMs should keep an eye on feature adoption rates.
How to measure it?
First, you’ll want to select a time frame over which to measure feature adoption. For example, you may want to consider adoption within one week of launch. Then calculate the percentage of total users who engage with the feature in question. A caveat: some users may be unlikely to use a feature simply due to the nature of their role within the organization. Measuring feature adoption at the account level might be more useful if you suspect that’s the case. Ideally, you’d measure feature adoption both ways.
Don’t stop with adoption rates directly after launch. Examine feature retention rates 30 days following launch as well to get a sense of typical drop-off patterns.

Product Stickiness:
If a product is sticky, users don’t just interact with it once and then forget about it. Instead, they engage with it on a regular basis. It becomes an integral part of their professional life.
This metric is an easy one to calculate because there’s a simple formula for it. Just take the ratio of your daily active users (DAU) to your monthly active users (MAU) to get your “stickiness score.” This represents the percentage of your monthly users who use your product every day. The higher the percentage, the stickier the product.
You want your users to rely on your product and interact with it regularly. Ideally, you want your product to become something they can’t live without. The more “sticky” features you offer, the higher the chances of providing real and sustainable value to your users
Product Usage:
Some of your features will get a lot of use, and some will go untouched (and they might not be the ones you’d expect). By measuring product usage, you can get a sense of the overall health of your product.
BDF Framework is useful to measure product usage.
Other important articles:
https://blog.amplitude.com/steps-measuring-feature
—————————————————————————————————
Product Faculty's 5 "S" Metrics Analysis Framework simplifies the key types of product analysis you can do to get a near-complete picture of your product.
SEGMENTATION — It’s easy to fall into the trap of looking at averages, but in almost all cases, digging into segments will give you a clearer understanding of root causes.
STRAIGHT-PATH — whether it's analyzing critical path funnels (that all users go through) or common-path that is use-case dependent can help you optimize paths or troubleshoot issues.
SESSION-BASED — You are either trying to increase the time user’s spend engaging with your product (common for Social apps), or reducing it (utility tools).
SATISFACTION — Love it or hate it, NPS is still a powerful way to measure product love (focus on NPS trends and indicators as “where to look” for issues)
STICKINESS — generally indicative that you are adding value to your users.
The end goal of all these analyses? Get to a flat-ish retention curve that is at or BETTER than your industry benchmark.
